Are you diving into social media marketing but feeling lost at sea? 🌊 Maybe you’re wondering if all the time and money you’re investing are sailing toward success. The compass to navigate these waters is understanding and tracking Social Media KPIs. 🧭
In this enlightening guide, we’ll unravel the mysteries of social media KPIs, with examples of real-life social media KPIs, essential insights on how to set them, and even a treasure map to track them! 🗺️✨
But before we embark on this exciting adventure, here are the foundational stones you’ll need to uncover:
📊 Social Media KPIs: Your golden key to gauge your online performance. 🧩 Examples of Social Media KPIs: Real scenarios to guide your path. 🎯 How to Set Social Media KPIs: Tailored strategies that fit like a glove. 🛠️ Tracking Tools & Templates: Your toolkit to measure and optimise.
Ready to steer your social media ship to uncharted territories of success? 🚀 Your adventure begins here. Let’s set sail! 🏁
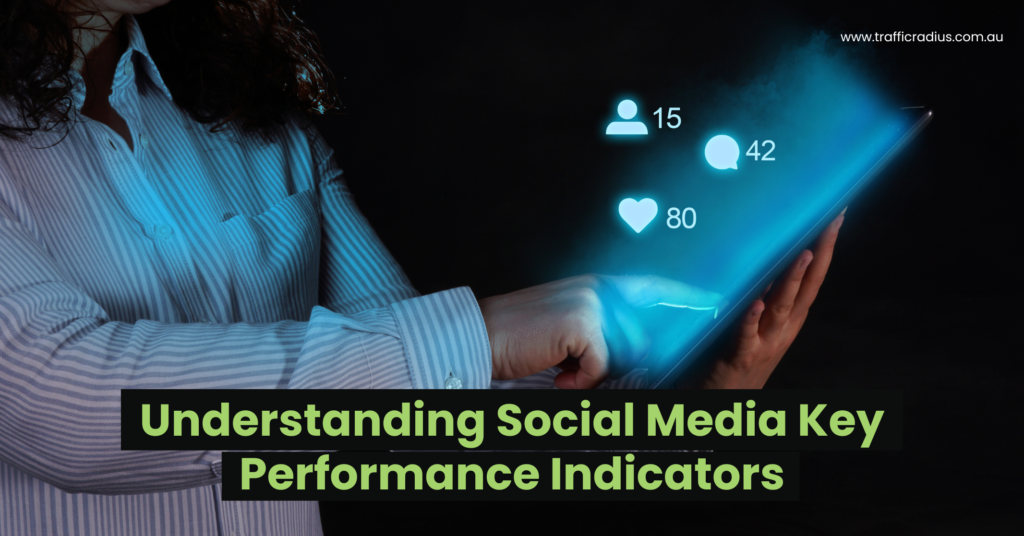
Understanding Social Media Key Performance Indicators
📊 Social Media KPIs: These aren’t just buzzwords; they’re the critical gauges you’ve chosen to assess the effectiveness of your social media marketing voyage. 🚀
They’re the numerical expression of your triumphs and pitfalls, quantifying if your strategic course has reached its destination. 🎯 Social Media KPIs spotlight the activities that have hit the bullseye—and those that have missed the mark.
Wondering if you’re sailing in the right direction? Your guidelines on how to set Social Media KPIs are the compass, the guide, and the encouragement to tweak the sails and catch the wind of success! 🌬️🧭
The Significance of Monitoring Social Media KPIs
🎯 Why Track Social Media KPIs? Here are the navigational beacons guiding your social media metrics and journey:
Navigating Towards Goals: 🧭 Think of Social Media KPIs as your GPS. They measure and direct your progress, keeping you aligned with the grand company objectives.
Steering Informed Decisions: 💡 With social media monitoring tools, your marketing KPIs transform into a spotlight. They reveal hidden patterns and successes, illuminating the road for strategic, fact-based decisions.
Benchmarking Your Fleet: 🚢 Want to know how you fare against rival ships? Social Media KPIs, complemented with a tailored social media tracking template, allow you to weigh anchor against competitors. Uncover your market position and flaunt areas where you sail ahead!
Embarking on social media metrics and expeditions without these guides is like sailing without a compass. Set your course with Social Media KPIs templates, leverage social media monitoring tools and chart your success with a social media tracking template. 🌟🌊
A List of 18 Key Performance Indicators for Social Media
![]()
Navigating the world of social media marketing KPIs? 🌐 It’s a vast ocean, with different types of metrics acting as guiding stars. 🌟 We’ve charted them into five prominent constellations, each lighting the way to a specific aspect of your marketing journey:
- Visibility
- Engagement
- Conversion
- Customer Satisfaction
- Share of Voice
Each category beams with common metrics companies typically follow, tailoring their strategic sails to the winds of the online world. 🚀🧭
KPIs Related to Social Media Visibility
👀 Seeing is Believing: These metrics are your telescope into the digital horizon, showing how many curious eyes (from steadfast followers to wandering strangers) glimpse your content.
The more vistas you open, the more doorways you create. 🚪 More visibility leads to more prosperous opportunities to hook users, forge connections, and guide them toward conversions.
And now, the glittering stars in your navigational chart, the top Social Media KPIs to sail towards increased visibility:
1. Insights on Impressions
Impressions represent the grand tally of times your content has graced a social media feed.
This figure captures each moment your content pops up in a user’s feed, be it as an original post or a shared item.
Notably, it considers repeating views by the same user. Therefore, the more frequently your content emerges in feeds, the loftier your impressions count will ascend.
The Significance of Impressions
Impressions act as a barometer 🌡️ for your content’s exposure
When the impressions soar high 🚀, it signals that your content is spreading its wings far and wide. This widespread circulation can ignite a chain reaction: enhancing brand recognition 🏷️, magnetising more followers 👥, and fueling higher engagement 💬.
2. Analysing Video Views
Video views are the tally of eyes 👀 that have feasted on your video content across various Social Media Metrics platforms.
Each platform dances to its own rhythm 🎶, having unique criteria for what makes a “view.”
For example, on Facebook, the view counter clicks at three-second watch time 🕒, while YouTube registers a view the moment a user hits play ▶️.
The Importance of Video Views
Video views are like applause in a digital theatre 👏, signalling the audience’s intrigue in your visual storytelling.
A rising number of views paints a picture 🎨 that your videos are striking the right chord, resonating with what your audience desires to see.
It’s not just a pat on the back; it’s creative intelligence 🧠. This insight shapes your content creation compass 🧭, guiding you to craft more videos that magnetise your audience, like a favourite song on repeat 🔁.
3. The Scope of Post Reach
Post reach is like sending out exclusive invitations 💌 to a virtual party. It marks the number of unique users who’ve glimpsed your social media post.
But wait, how is it different from impressions?
Reach counts the individual guests at your party, each one only once, regardless of how many times they’ve peeked at your invitation. Impressions, on the other hand, would include every single peek
In the world of Social Media KPIs, it’s the one-to-one handshake 🤝, ensuring that your content isn’t just passing by but making a unique connection. It’s about quality encounters over quantity, amplifying the resonance of your social media tracking tools and strategy.
The Necessity of Understanding Post Reach
Reach is like casting a net into the digital ocean 🌊. It helps you grasp how far your content is sailing beyond your immediate followers, touching distant shores
Think of it as the telescope 🔭 of your social media ship, giving you a clear view of how expansive your potential audience might be. It’s not just about who’s on board, but who’s on the horizon, beckoning a new wave of engagement and connection. 🚀
4. Assessing Follower Numbers
Follower count is like the heartbeat 💓 of your social media profile, pulsing with the number of users—both individuals and brands—who’ve opted to join your digital journey
When new explorers hop on board, the count climbs 📈. But when some disembark, it descends 📉
A drop in followers? Don’t panic! 🚫 It might just be a sign that your content is sharpening its focus 🎯, homing in on a specific audience. It’s about quality connections over quantity, guiding your social media tracking template and strategy towards genuine engagement.
The Relevance of Follower Count
Your follower count acts like the applause meter 🎉 of your brand’s popularity, echoing how well your content resonates with the crowd.
More followers? It’s a standing ovation 🥳, signifying that people are smitten by your content and are hungry for more
It’s not just a number; it’s a testament to your brand’s charisma and a hint of the growing tribe who wants to dance to your digital tune 🎶.
5. Growth Rate of Audience
The audience growth rate is like the speedometer 🚀 of your social media journey, showing how swiftly your following is climbing (or perhaps descending), measured in the lively dance of percentages
How’s it calculated? 🧮 Take the difference between the number of followers at the finish line and the starting gate and then divide by the number of followers at the start.
Why Tracking Audience Growth Rate Matters
Keeping an eye on your audience growth rate is like watching the speedometer on a thrilling road trip 🚗💨. It clues you into how briskly you attract new followers to your social media adventure
Is the speed thrilling, with rapid growth? 🚀 That’s a green light, signalling that your social media strategy is cruising in the fast lane
But if the growth feels like a slow crawl 🐌, it might be time to tinker under the hood, adjusting the social media calendar and reevaluating your overall approach
KPIs Centred on Social Media Engagement
Engagement metrics are the heartbeat 💗 of your social media connection, painting a vivid picture of how users tango with your content.
They’re like the applause, laughter, and whispers in a lively conversation, reflecting your audience’s connection 🤝 and affection for your brand. It’s not just about looking; it’s about engaging, reacting, and bonding.
Are they enamoured with your posts? These metrics hold the mirror 🪞 to their fascination.
Here’s a spotlight on some key social media KPIs that echo this vibrant engagement: 🎭
6. Examining Reactions
Reactions are the emojis 😃❤️🎉 of engagement in your social media world. Whether it’s a “Like,” “Love,” “Celebrate,” or an emotional gesture, each click is a virtual high-five or a nod from your audience.
Different platforms offer diverse emotional palettes 🎨. Facebook serves a colourful array, from “Love” to “Angry” and “Sad.” Meanwhile, Instagram keeps it chic with primarily “Likes.”
Think of these reactions as the audience’s way of whispering in your ear, a simple yet profound way to interact 🤝 with your content and spill their feelings.
The Value of Reactions
Tracking reactions is like taking the pulse 💓 of your content’s emotional resonance. A flurry of “Likes,” “Loves,” and other emojis is more than a digital pat on the back. It’s a standing ovation 🎉, signalling that your content is striking the right chord.
A high number of reactions? You’ve hit the jackpot 🎰! It’s a treasure map, guiding you to create more of the content your audience craves.
7. Exploring Comments
Comments are the virtual conversations 🗨️ that spark around your social media content. They’re more than mere text; they’re the dialogues, debates, praises, or even questions that unfold in the digital public square.
Users pen these responses ✍️ to your posts or reply to others, tagging friends, your account, or anyone they want to bring into the conversation.
The Importance of Comments
Comments are the social media equivalent of a lively debate or heartfelt conversation 🗨️💬. They signify more than a mere glance; they’re a sign of genuine interest, engagement, and thought.
Why are they crucial as a KPI? Because comments are like applause with an encore 🎭👏. Content that attracts lots of comments doesn’t just linger; it takes centre stage, gaining more visibility.
By carefully monitoring 🧐 these textual interactions, you can uncover golden insights into what your audience truly cares about. It’s like having a direct line 📞 to their thoughts and preferences.
8. Analysing Shares
Shares are the digital equivalent of word-of-mouth marketing 📣. When users repost your content on their own social media walls, it’s like a virtual endorsement, a stamp of approval
But sharing doesn’t always mean a simple repost. Sometimes, users add their own twist, sprinkle in their thoughts 💭, or give added context to the content. It’s like passing along a favourite book 📚 with personal notes scribbled in the margins.
These shares, with or without personal insights, amplify your reach, spreading your message further and wider. They turn your post into a social media ripple effect, where one share leads to another and another 🔄.
9. Tracking Saved Posts
Saves, or “Bookmarks” on some platforms, are like putting a virtual dog-ear 🐶 on your favourite page of a book 📖. They let users tuck away your post for later, keeping it in a special nook of their profile.
Whether it’s a swipe of a thumb or a click of a mouse, saving a post is a user’s way of saying, “This is worth coming back to.” 🌟
Platforms like Instagram take it a step further, allowing users to create collections 🗂️, grouping saved posts into different categories. It’s like a digital scrapbook, helping users organise and cherish resonating content.
Why Tracking Saves Is Crucial
Saves are like virtual gold stars ⭐ in the world of social media. When users save your content, they’re telling you, “This is worth a second look!” 🧐
It’s more than just interest; it’s a commitment to come back. A bookmarked promise that your content has struck a chord 🎵. Whether it’s a recipe, a quote, or an inspiring image, a save is a vote of confidence, a subtle nod to the value you’re offering.
10. Calculating the Average Engagement Rate
Your average engagement rate 📊 is like a social media pulse check 💓. It’s calculated by taking the total interactions (likes, comments, shares, etc.) 🎉, dividing them by the total number of posts 📝, and then dividing that result by your number of followers 👥. Multiply by 100, and voilà! You’ve got your rate 🥳.
Why the Average Engagement Rate Matters
A high engagement rate 📈 shows your content is hitting the mark 🎯 with your audience. It’s sparking interest 💥 and kicking off conversations 🗨️. In essence, it’s a big thumbs-up 👍 for relevance and quality in your social content!
KPIs Related to Social Media Conversions
Conversion metrics 📊 gauge the power of your content in prompting users to take specific actions, such as buying a product 🛒 or completing a form 📝.
Here’s a look at some vital conversion-centric social media KPIs:
11. Click-Through Rate Analysis
Click-through rate (CTR) 🖱️ represents the ratio of users who clicked a link in your social post to the total viewers of that post. It’s not just vital for ads 📢 but also for assessing organic social performance.
To calculate CTR, divide the clicks 🖱️ your post received by its impressions (total views) and multiply by 100 to obtain the percentage 📈.
Why Click-Through Rate Is Key
This social media KPI, the Click-through rate (CTR) 🖱️, pinpoints what content excels in guiding users to crucial destinations like landing pages 🎯. A high CTR indicates that your message is striking a chord with your audience, encouraging them to act 🚀
2. Understanding Conversion Rates
The conversion rate 📈 is a powerful social media KPI that reveals the percentage of users who take your desired action, be it signing up for a newsletter 📧 or making a purchase 🛒, after engaging with your post or ad. It’s calculated by taking the number of conversions and dividing it by the total number of clicks, then multiplying by 100 to obtain the percentage. A higher conversion rate means your content is attracting attention and prompting action! 🎉
The Importance of Conversion Rate
A high conversion rate 📊 signals that your social media content is not just eye-catching but action-driving 🚀. It’s a key measure in assessing how your social endeavours align with achieving business objectives like lead generation 🎣 or boosting sales 💰. It’s more than just popularity; it’s about real impact! 🎯
13. Cost-Per-Click Insights
Cost per Click (CPC) 💸 is the amount you pay each time someone taps on your paid social ad. It’s a critical metric if you’re engaging in paid advertising 📢, as it helps you gauge the expense for each interaction. Simply put, CPC = Total Ad Cost ÷ Number of Clicks. It’s a direct measure of what each click is costing you, so you can plan and optimise accordingly! 🎯
The Significance of Cost Per Click
CPC provides an insightful measure 📏 of the cost for each click on your social media ad campaign. Understanding this helps you evaluate the cost efficiency and spot opportunities for optimisation 🎛️. It’s all about getting the most value for your advertising dollars! 💰
14. Measuring Sales Revenue
Sales revenue from social media 📈 shows the total income directly linked to your social media marketing endeavours. By using tracking codes in URLs or specialised Social Media Analytics tools 🛠️, you can follow the customer’s journey from a social media click all the way to a purchase. It’s a vital metric that helps understand how your social media efforts translate into real dollars! 💲
Why Tracking Sales Revenue Is Vital
Tracking social media sales revenue 📊 illustrates the tangible financial impact 💰 of your social media campaigns. It justifies the investment of time and resources 🕒🛠️ in social media marketing, showing a clear connection between your efforts and monetary success. 🚀
KPIs Pertaining to Customer Satisfaction on Social Media
These metrics, often managed through Social Media Tracking Tools 🛠️, are vital indicators of your customers’ satisfaction 😊.
A high level of customer satisfaction can fuel increased loyalty 💖 and lead to more future sales 📈. This contributes directly to business growth 🚀.
Here are some common social media KPIs that utilise Social Media Tracking 🧭 to gauge customer satisfaction:
15. Monitoring Review Ratings
Social media reviews 🌟 are reflections of customers’ thoughts on your product or service, shared across various platforms. Often accompanied by a rating, these reviews provide valuable feedback.
Usually expressed on a scale from one to five, you can calculate an average rating 📊 to grasp customer satisfaction in a comprehensive way.
The Importance of Review Ratings
Social media reviews 📝 offer direct insights from your customers, letting you gauge their satisfaction level. This precious feedback helps you spot areas that shine ✨ and those that might need a little more polish 🛠️.
16. Evaluating Customer Satisfaction Scores
Your customer satisfaction (CSAT) score 📊 on social media shines a light on how thrilled your customers are with your product, service, or experience. Want to measure it? Try conducting surveys or polls 📝 on social media platforms!
Customers rate their joy on a scale from one (very unsatisfied 😞) to five (very satisfied 😃). To find your social media CSAT score, simply divide the number of contented customers (those who scored a four or five) by the total number of responses, then multiply by 100 to get a percentage. 🎯
Why Customer Satisfaction Scores Are Essential
Your CSAT score 🎖️ is like a mirror reflecting your customers’ thoughts about the quality of your product or service. 🧐
Seeing a change in this score? 📈📉 It’s not just numbers; it’s a trend showcasing what your audience feels. By keeping an eye on these trends with your Social Media Tracking Tools, you can respond proactively 🚀 to the shifts in customer sentiment.
Social Media KPIs Related to Brand Voice Share
Share of voice 📣 is all about gauging your brand’s presence within your specific niche, like slicing into a conversation pie 🥧.
17. Tracking Brand Mentions
Brand mentions 🏷️ occur when users talk about your brand on social media, either by tagging it directly or simply mentioning it in a post or comment.
With the use of Social Media Tracking Tools 🛠️, you can gauge these mentions, even when your brand isn’t directly tagged.
The Relevance of Brand Mentions
Tracking brand mentions 🏷️ through Social Media Tracking Tools 🛠️ offers insight into how often your brand is being discussed on social platforms.
This helps you evaluate brand awareness 🌐, understand public sentiment ❤️😡, and identify loyal advocates 📣 of your brand. It’s vital to maintaining a finger on the pulse of your brand’s online presence.
18. Insights into Branded and Campaign Hashtags

Branded hashtags 🏷️, specific to your company or slogan, and campaign hashtags tied to marketing efforts, serve to categorise your social media posts.
By grouping them under the same hashtag, they become discoverable 🧐 to users interested in those specific topics. Utilising Social Media Tracking Tools 🛠️, you can keep track of these hashtags to monitor how effectively they’re engaging your target audience.
Using branded and campaign hashtags 🏷️ enhances your presence on social media platforms. When users search for or click on these specific hashtags, they are guided to a collection of posts tied to your brand or campaign 📜.
Selecting the Appropriate Social Media KPIs
After delving into various social media KPI examples, remember that you don’t have to track them all. To choose the right social media marketing KPIs for your strategy, consider these guiding tips:
Clarifying Your Goals
Begin by pinpointing your business objectives 🎯. These will guide your social media strategy and goals.
Are you after brand awareness 🌐, sales 🛒, or top-notch customer service? Align your social media KPIs with these aims.
Imagine a small business aiming to boost sales 📈. Their focus might be on conversion rates 💼 and sales revenue 💰. This synergy between goals and KPIs is key in the realm of Social Media ROI and Social Media Analytics 📊.
Examining Your Industry
Your industry plays a role in shaping your crucial KPIs ⚙️. Consider this: in ecommerce, conversion rates and sales revenue reign supreme 💼💰. While for a nonprofit, the spotlight may shine on average engagement rates and reach 📈🌐.
Curious about your rivals’ strategies? Use EyeOn to explore how competitors are chasing their social media goals 🕵️♂️. It’s all about finding the perfect metrics blend for your unique journey 🚀.
Prioritising Specific KPIs
Kick off with pivotal metrics that sync up with your business objectives 🚀. Remember, quality over quantity is key.
Resist the urge to track a surplus; too much data can cause analysis paralysis 📉. Keep your focus on what truly matters.
And don’t forget, you can expand your tracking scope down the road if necessary 🌱. It’s about making informed decisions, step by step! 📊🏃♂️
Creating Goals for Social Media KPIs
Now that you’ve pinpointed your social media marketing KPIs for tracking, let’s set the stage for success with clear goals! Here are two crucial steps to guide you:
9th H3: Compare Yourself with Competitors
Gaining insights from competitors is a must ✅. It helps you gauge the achievable and set your targets. Dive into their world with tools like Social Tracker 🕵️♀️ to scrutinise their social media game. It’s like peeking over their shoulder, learning from their successes and challenges. 🚀🔍
Creating Measurable and Specific Goals
Enter SMART goals 🎯: Specific, Measurable, Achievable, Relevant, and Time-bound. Each goal for your social media KPIs should wear this badge of honour:
- – Specific: Your goal should be crystal clear and easily comprehensible.
- – Measurable: Progress tracking should be quantifiable 📈.
- – Achievable: Set goals that are realistic and within reach.
- – Relevant: Make sure your goal aligns seamlessly with your overall business objectives.
- – Time-bound: Every goal should have a deadline, keeping you on track.
With SMART goals in your corner, you’re setting a focused and results-driven path! 🌟🚀
Methods to Monitor Social Media KPIs
Navigating the tracking journey for your social media KPIs? You’ve got two trusty companions on board:
1. Built-in analytics tools 🛠️: Harness the power of platforms’ native analytics features.
2. Third-party analytics tools 📊: Call in the experts! Rely on specialised tools designed to dissect, interpret, and elevate your KPI data.
Whether you choose the onboard analytics or bring in a third-party co-pilot, the destination is better-informed decisions and optimised strategies! 🚀📈
Utilising Built-In Analytic Platforms
Native analytics tools, gifted by each social media platform, are your personalised data hubs 🏰.
They serve up insights on your profile, posts, and audience. Take Meta Business Suite’s Insights reports, for example. These treasure troves dish out in-depth stats on your performance across Facebook and Instagram
It’s like having a Social Media dashboard tailored to your social journey, making informed choices a breeze! 📊🚀
Leveraging Third-Party Analytic Tools
Unlock the power of third-party analytics tools, such as Social Media Analytics 🛠️. These versatile wizards bring together your social media performance in one panoramic view.
These tools give you a deep dive into insights and effortless performance tracking and comparison over time. It’s like having your own data command centre!
Ready to kick off? Head to Social Media Analytics and seamlessly integrate your social profiles. Whether it’s Facebook, Instagram, or LinkedIn, this magic box collects data on new followers, post reach, engagements, and engagement rates. 📊📈
No more scattered stats; it’s all here, ready for your perusal! 🚀🔍
Begin Monitoring Your Social Media KPIs
In the realm of social media marketing, the KPI options are abundant 🌟. Your task? Handpick the ones that align perfectly with your business goals.
Don’t forget to gear up with the right social media monitoring tools 🛠️. Having the proper instruments at your disposal ensures you’re confidently tracking, analysing, and optimising. The blend of smart choices and powerful tools propels your success! 🚀📊